2024 ICM Problem E: Sustainability of Property Insurance
还在比赛的时候我就想好了,赛后一定要向全世界公布这令人绝望的 S 奖预定论文影像(最后实际上是 H,我真觉得组委会目害了啊不是我们真的很牛逼了),让大家看到一个痛苦的文盲、用嘴建模的废物写出的 25 页论文(喜
最后一天凌晨四点左右才发现要求 summary sheet 字体必须是 Times New Roman,看了下往年论文也没有用 palatino 的就全文都改了,然后就只有撑满的 24 页了,枉费我写的时候感觉可能不妙就一直压行。
Summary
The growing threat of frequent meteorological disasters is endangeringour planet. To promote the healthy development of the insurance industry, we established an Insurance Model to measure the impact of weather disasters, and implemented gradient insurance policies in two different regions. We have also established a Landmark Preservation Model and proposed relocation suggestions for the Vizcaya Museum and Gardens to evaluate preservation measure, and protect people's beloved landmarks.
Firstly, we utilized Entropy Weight Method to assess hurricane disaster risk in Florida and rainstorm disaster risk in Indonesia. We constructed a climate risk index (WDRI) with universality in meteorological aspects. Subsequently, we respectively employed ARIMA and prophet models to forecast the Style Risk Factor for both regions. Conducting single-factor analysis and multivariate analysis at both the logical and empirical levels, we eliminated or equally weighted factors where risk exposure was not significant, negatively impacting the goodness of fit (\(\textbf{R}^2 > \textbf{0.98}\)), and VIF indicators (final \(\textbf{VIF} < \textbf{2}\)) of the model. Following this, we performed multiple regressions of premium pricing on several factors, achieving a model confidence level of over \(\textbf{90} \textbf{\%}\).
Furthermore, we devised graded underwriting strategies and obtained a baseline CDVI for insurance companies targeting regions experiencing an increasing frequency of extreme weather events. Under the condition of maintaining the loss ratio for insurance companies among \(\textbf{60}\textbf{\%}\) to \(\textbf{100}\textbf{\%}\), we aimed to minimize the insurance protection gap to the greatest extent possible.
Then, based on the premium pricing result of the insurance model and climate risk index (WDRI), we incorporated repair costs to provide a multiple linear regression calculation method and theoretical explanation for the Local Livability Index (LVI). Furthermore, we presented different land use scenarios under various LVI conditions, making it possible to better utilize land resources in the context of population growth.
Afterwards, by understanding the assessment scheme for historic landmarks in the latest MAHT model, we established the Landmark Preservation Model based on four indicators: historical and cultural significance, resident satisfaction, disaster risk measurement WDRI, and building damage level. We developed a decision flowchart for implementing protection measures for landmark buildings under different circumstances.
Finally, we used this model with over 60 sub-indicators to evaluate the protection measures for the Vizcaya Museum and Gardens in Miami, with a WDRI of 0.825 thus cannot be insured. By calculating the corresponding Landmark Weather Disaster Vulnerability Index (LWDVI) as 2.554, which indicates a relatively high level, we identified the need for relocation due to the inability to implement adequate protection measures and the predicted future submergence. A community letter was also written accordingly.
Keywords: Property Insurance Model, Prophet Model, Entropy Weight Method
Introduction
Problem Background
Climate change is leading to an increase in the frequency and severity of extreme weather events across the globe. This phenomenon has profound implications for property owners, insurers and communities. The cost of damages from natural disasters is skyrocketing, leading to escalating insurance premiums and, in some cases, insurers withdrawing coverage altogether in high-risk areas. This crisis threatens the affordability of homeownership and the financial stability of the insurance industry.
To cope with challenges brought by climate change, it's important to seek methodologies to guide decision-making for both insurance companies and community leaders. The overarching goal is to promote a sustainable property insurance system that balances the need for affordable coverage with the long-term viability of insurance providers, all while considering the preservation of communities and their cultural heritage.
Restatement of the Tasks
Considering the background information and restricted conditions identified in the problem statement, we need to solve the following tasks:
Task 1: Develop an index to measure the risk of meteorological disasters in a given location with historical data. Determine the factors of the insurance model. Devise a rule to obtain the insurance coverage provided by an insurance company in a particular region.
Task 2: Utilize this index to measure the risk of specific disaster losses in two different continents (we select Florida in the United States and Indonesia), calculate and predict future premiums, and assist insurance companies in determining the coverage scope of insurance services.
Task 3: Apply the developed insurance model to assist community decision-makers in planning future property construction, including site selection, construction techniques, and other aspects in a future where the local population continues to grow and faces increasing meteorological uncertainties.
Task 4: Compare the costs and social value of protecting buildings by estimating the economic and cultural value of buildings within a community, and using existing indexes to assess the severity of disasters.
Our Work
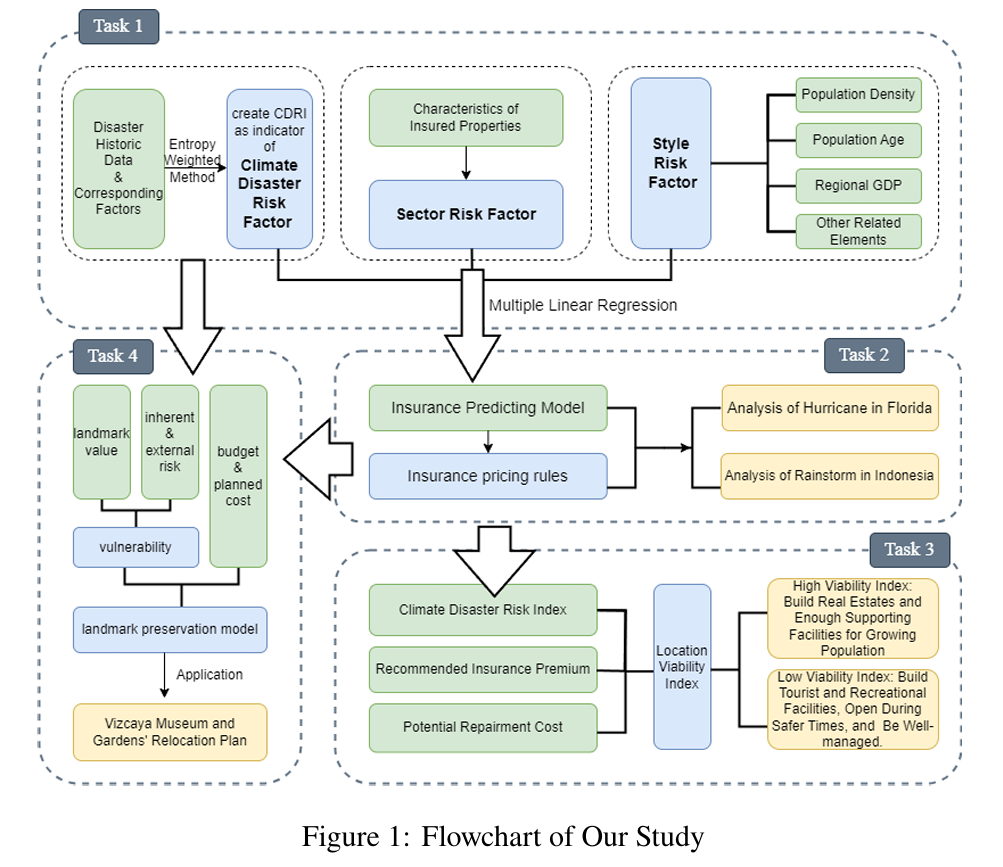
To address the multi-dimensional estimation problem in such a complex system, we referenced a large amount of relevant work and established two models: the Insurance Model and the Landmark Preservation Model. The schematic diagram of our study is shown in Figure 1. First, we constructed a measure called WDRI to reflect the severity level of meteorological disasters in a region. The WDRI was obtained through standardizing data related to specific meteorological disaster factors and applying the Entropy Weight Method. Next, we used this measure along with Section/Style Risk Factors to develop a model for predicting changes in local insurance costs using multiple linear regression and prophet. Based on this model, we devised a method for calculating insurance premiums in different regions for insurance companies.
Subsequently, we demonstrated this model using examples from two different regions and designed a new measure called LVI, which helps real estate companies determine the geographical location for property development and strategies for development in various locations based on empirical rules from relevant literature. Finally, by referencing relevant literature, we utilized the MAHT model 1 to design a measure, LV, for calculating the value of landmark buildings. By combining the previously obtained WDRI, we calculated a measure, LCDVR, for determining the protection needed for landmark buildings, and established a decision-making flowchart for protection measures to assist decision-makers.
Assumptions and Justifications
Assumption: The average housing rental prices and insurance premiums in an area change proportionally at the same time.
Justification: During severe disasters, risks are generally positively correlated with property values. Therefore, using the average rental prices in the housing market to represent insurance premiums is considered a reasonable proxy.
Assumption: The duration of the hurricane exhibits an exponential relationship with the pressure difference (\(P_{normal} - P_{min}\)).
Justification: We assume that the process of pressure recovery in the hurricane center from its minimum to normal pressure follows the Exponential Decay equation2 \(P(t) = P + (P_{normal} - P) \times (1 - exp(-t \tau))\), where \(P(t)\) denotes pressure at time t, \(P_{min}\) represents the minimum pressure in the center of the hurricane, \(P_{normal}\) is the normal pressure, and \(\tau\) is the time constant characterizing the rate of pressure recovery. Also, we assume that \(\tau\) remains consistent across hurricanes.
Assumption: The residents' satisfaction and local viability index (LVI) in an area change proportionally at the same time.
Justification: Recent studies show that the life satisfaction of local residents is mainly related to community density, population size, economic development level, age distribution of residents, and per capita income3. These factors can be approximated as measures of the local viability index (LVI) and used as such after standardization4. This is consistent with common sense, as there is a very high correlation between residents' satisfaction and the livability of an area.
Notations
The key mathematical notations used in this paper are listed in the following table.
| Symbol | Description |
|---|---|
| \(WDRI\) | Weather Disaster Risk Index |
| \(BWDRI\) | Baseline Weather Disaster Risk Index for Insurance |
| \(LRT\) | Loss Ratio for insurance companies |
| \(LV\) | Landmark Values |
| \(LR\) | Landmark Risks |
| \(IPP\) | Insurance premium plan |
| \(RC\) | Projected costs of repairs/rebuilds under potential climate event scenarios |
| \(LVI\) | Local Viability Index |
| \(LIR\) | Inherent Risk of the Landmark |
| \(LWDVI\) | Landmark weather disaster vulnerability index |
| \(r_x\) | Radius of Maximum Wind (in nautical miles) in x |
| \(p_x\) | Minimum Pressure (in millibars) in x |
| \(w_x\) | Maximum sustained wind (in knots) in x |
| \(t_x\) | Temperature in x |
| \(pop\) | Population in an area (million people) |
| \(age\) | Median age of an area (year) |
| \(GDP\) | Annual GDP of an area (thousand dollars) |
| \(\text{property price}\) | Residential Property Prices for Indonesia (Index 2010=100) |
| \(RH_{avg}\) | Average humidity (%) |
| \(RR\) | Rainfall (mm) |
| \(T_{avg}\) | Average temperature(\(^\circ C\)) |
| \(ff_{avg}\) | Average wind speed (m/s) |
| \(ss\) | Duration of sunshine (hour) |
Insurance Model
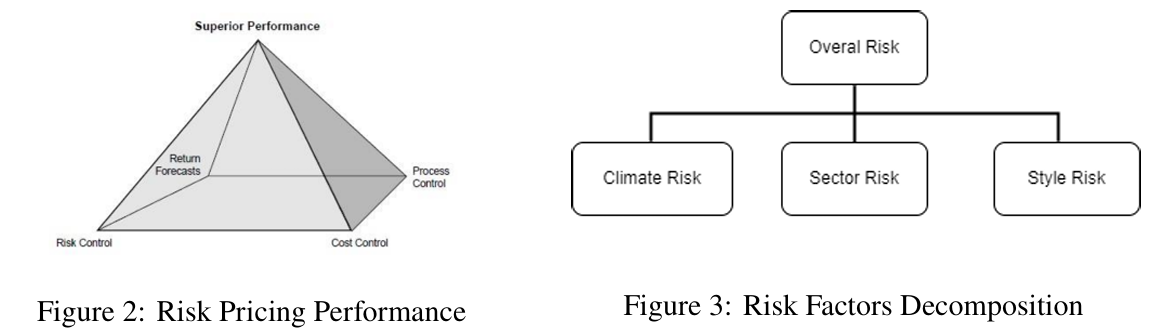
We can categorize risk pricing performance into the following four implications:
Return Forecast: Formulating reasonable and effective predictions of returns.
Process Control: Monitoring the entire insurance premium pricing process to maintain consistency between pricing and actual production.
Cost Control: Avoiding excessive or inefficient transactions.
Risk Control: Capturing market opportunities under prudent considerations.
Taking into account various factors, we can express the claims risk in the following multiple-factor model, and is interpreted more vividly in
\[\text{insurance price} = \sum_{k=1}^n \beta_k x_k +\varepsilon\]
In the model, \(x_k\) represents the original values of the factors, \(\beta_k\) represents the risk exposure of insurance price to the \(x_k\) factor, and \(\varepsilon\) is the model residual. Moreover, in the premium pricing model there are three categories of risk factors: climate risk factors, sector risk factors, and style risk factors (see Figure 3).
The Weather Disaster Risk Factor reflects the severity of certain or multiple meteorological disasters on the local area. This should be quantified by collecting relevant historical data on disasters and analyzing potential influencing factors specifically.
The Sector Risk Factor mainly include the characteristics of the insured property, such as the structure of buildings, materials used, construction age, etc. In other words, we can assess insurance prices based on the nature of the insured property. Logically, this assumption is plausible. For example, concerning the construction age, older buildings are more susceptible to damage, leading to higher compensations for the property. In subsequent empirical verification, the establishment of dummy variables for factors like building materials, structure, and construction age being greater than a specific reference value to access the overall risk characteristics of insured buildings in a region.
The third category of factors is Style Risk Factors, including population density, population age, regional gross domestic product (GDP), and other elements. Logically, we can understand that a region with a higher population density often indicates a higher level of economic development and more concentrated housing, resulting in more assets affected by disasters, which should lead to higher premiums. The same reasoning applies to factors like GDP. However, it is worth noting that these factors may exhibit multicollinearity, leading to potentially inflated estimates of correlation.
After establishing the premium pricing model, we can conduct a cost-benefit analysis for insurance companies and determine underwriting policies and reference standards based on the risk index and regional economic development. The first evaluation metric is the WDRI, and the second is the loss ratio (LRT) defined as follows:
\[LRT = \frac{\text{Losses Incured}}{\text{Earned Premium}} \times 100 \%.\]
According to relevant surveys, residents' insurance expenses are roughly around \(5\%\) of their average personal income. Therefore, if, under a given disaster risk scenario, the predicted premium (denoted as predicted price) exceeds \(5\%\) of the average personal income, it is recommended that the insurance company refrains from underwriting in that region. The rationale is that residents in that area are likely to perceive the insurance cost as excessively high, discouraging them from purchasing insurance.
After obtaining the residents' insurance expenses, we can apply it to the insurance model and inversely get the corresponding baseline WDRI (BWDRI). It is advised that the insurance company does not underwrite in areas with higher WDRI than the baseline.
To access the recommend policies concretely, the loss ratio (LRT) should be taken into consideration. The lower the value of the loss ratio, the better the performance of the insurance company in claims handling.Generally, the profitability of insurance companies relies on accurate pricing and claims management. If the loss ratio doesn't exceed \(100\%\), the insurance company has a surplus in claims expenditures, meaning there is a remainder between the received premiums and the claims paid, and is acceptable.
Application of the Insurance Model in Two Areas
To illustrate our model, we have selected two regions, Indonesia in Asia and Florida State in North America, for analysis. Florida is known to be prone to hurricanes, while Indonesia is susceptible to rainstorms and earthquakes.
Analysis of Florida State, USA
Background
Florida is located in the northwestern part of the Atlantic Ocean and is frequently affected by weather disasters. Home insurance costs in Florida are increasing substantially, causing concern among propertyowners, community managers, and potential buyers about the future of the insurance market in the state.
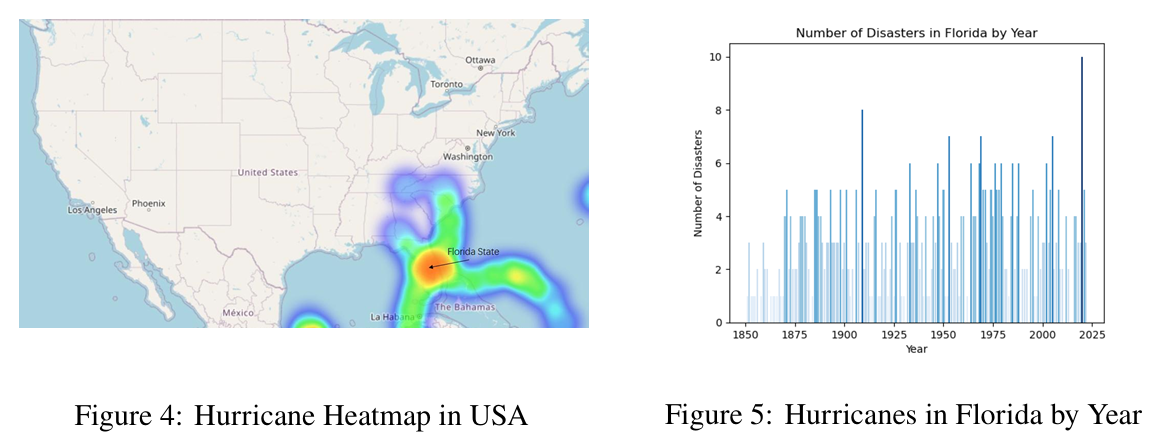
Among the weather disasters affecting Florida, the most severe ones are hurricanes. According to data collected by the National Oceanic and Atmospheric Administration (NOAA), a heat map (see Figure 4) and a histogram (see Figure 5) both reveal that the severity of hurricane damage in Florida in the eastern United States is extremely strong.
Conclusions Obtained by Insurance Model
Firstly, we construct the Weather Disaster Risk Index (WDRI) to quantify the Climate Risk Disaster Factor. Data on hurricane trajectories of Northern Atlantic from 1994-2022 was collected, where Radius of Maximum Wind (\(r_i\), in nautical miles) ,Minimum Pressure (\(p\), in millibars) ,Maximum sustained wind (\(w\), in knots) and temperature (\(t\), in Fahrenheit degrees) are known. Normalization was applied to the data in order to balance discrepancies among different measurement units.
The WDRI is accessed through Entropy Weight Method, which determines the weight of each coefficients. The desired model construction is as follows5:
\[WDRI = r_i^2 \times (\log (p_0 - p_i)+ c_1 \times t) \times w_i^3\]
We assume that \(r^2\) is proportional to the hurricane's force range and \(\log(p_0-p_i)\) is proportional to the hurricane's duration. Furthermore, given that a hurricane is powered by the condensation from heat, \(c_1 \times t\) is used to represent the weakening effect of low temperatures on the hurricane. The wind force (F) is proportional to the cube of the wind speed (V), i.e., \(F\propto w^3\).
Given the climate data of each area in the Florida State, we can calculate the WDRI index for various regions in the state of Florida. At the same time, by collecting data on the local population (pop), average age (age), and GDP to represent the Style Risk Factor, and assuming the use of local real estate rental prices as the insurance cost indicator, we can use a multiple linear regression model to estimate and predict insurance costs.
Now try to identify the effectiveness of the factors by conducting a correlation analysis among the existing factor sequences (see Figure 6).
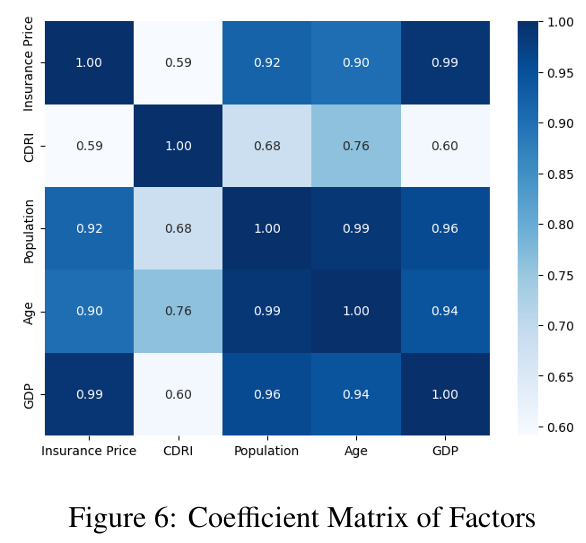
All four factors exhibit relatively high correlations with insurance prices, indicating predictive potential. Notably, the correlation between pop and age is remarkably high at 0.9881, and the correlations among pop, age, and GDP all exceed 0.9. In light of these high correlations, we may consider synthesizing these factors for subsequent calculations.
If we proceed with a multiple regression using the four factors directly, the model's \(R^2\) is close to \(1\), indicating an excellent fit. However the average \(VIF\) for this model exceeds \(10\), suggesting the possibility of multicollinearity among factors.
By continuously adjusting the number of factors and interaction relationships in the model, we ultimately obtain the model:
\[\text{insurance price} = 19591.13 + 255.7892 WDRI - 496.4459 age + 2.34 \times 10^{-6} GDP + \varepsilon.\]
Its advantage lies in minimizing the \(VIF\) value as much as possible, thereby eliminating the impact of multicollinearity on the model. At the same time, as a trade-off, there is a slight decrease in the \(R^2\) value, but it does not greatly affect the power of explanation.
By individually predicting the values for each factor and then using the above model to calculate the predicted price, we obtain the results shown in the following table:
| year | insurance price | WDRI | age | GDP | predicted price | bias |
|---|---|---|---|---|---|---|
| \(2023\) | \(2082.748864\) | \(0.164995\) | $ 44.58478$ | \(1458543489\) | $2012.396311 $ | \(3.38\%\) |
| \(2024\) | \(2200.818663\) | $ 0.140109$ | \(44.80708\) | $1468596527 $ | $2119.191825 $ | \(3.71\%\) |
| \(2025\) | $2318.888461 $ | \(0.294665\) | \(45.02939\) | $1470572644 $ | $2252.986414 $ | $2.84% $ |
The bias between the predicted price obtained from the model and the officially predicted insurance price is approximately \(3\%\), within an acceptable margin of error. Therefore, we consider the model pricing to be effective.
Based on statistical data, the typical annual income for residents in Florida is \(\$52,000\) USD. Using this data, with \(5\%\) as the maximum predicted premium value, the regression model calculates that the WDRI should be less than or equal to \(0.74\).
In cases where the predicted premium price is greater than \(1\%\) but less than \(5\%\) of the average annual income, the corresponding storm risk range should be between \(0.34\) and \(0.74\). It is recommended that the insurance company can maintain a loss ratio below \(100 \%\) (profitable) and selectively decrease the loss ratio, for example, setting it at \(60\%\). Under this standard, the insurance company can introduce an insurance product: charging \(\$492\) USD per square meter of property at one time and paying a premium of \(\$1560\) USD during a five-year insurance period.
In situations where the predicted premium price is less than \(1\%\) of the average annual income, the corresponding WDRI is less than \(0.34\), indicating a lower probability of hurricanes damage. In such cases, the insurance company slightly increase the loss ratio to enhance its commercial competitiveness, for instance, setting the loss ratio at \(70\%\). Under this standard, the insurance company can introduce an insurance product: charging \(\$162\) USD per square meter of property at one time and paying a premium of \(\$520\) USD during a five-year insurance period.
It is important to note that in a specific market environment, insurance companies may adopt different strategies to adjust the loss ratio to maintain competitiveness and profitability.
Crucially, a low loss ratio is not always favorable, as it may indicate the company is overly conservative in risk assessment, leading to excessively high premium pricing and potential loss of competitiveness. Also, the establishment of the loss ratio also reflects, to some extent, the social responsibility of insurance companies. In areas where residents' annual income is relatively low, we recommend insurance companies adopt a higher loss ratio insurance policy to help reduce Insurance Protection Gap for vulnerable people in disasters. This policy not only yields the effect of profits but also helps to establish the responsible social image of the insurance company, contributing to the sustainable development of the enterprise.
Analysis of Indonesia
Background
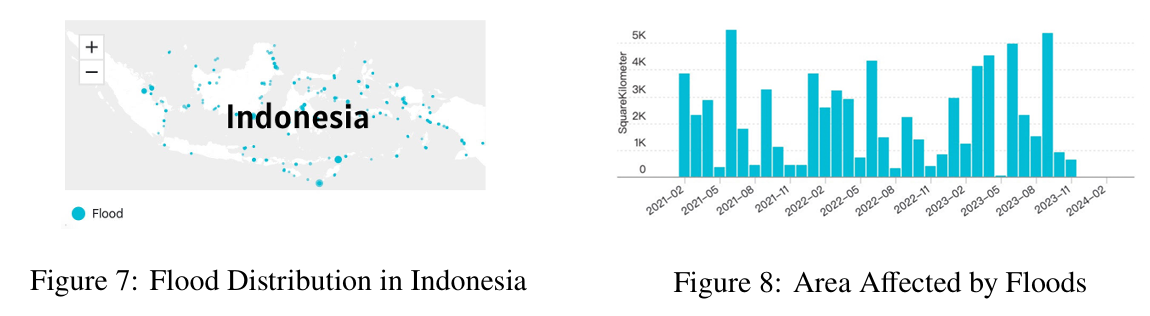
Indonesia, a country made up of thousands of islands, is prone to severe rainstorm disasters due to its location. The country experiences frequent flooding, land-slides, and other related disasters, which lead to destruction to infrastructure, homes, and agricultural land, as well as loss of lives and displacement of communities. (see Figure 7, 8)
Conclusions Obtained by Insurance Model
We continue to employ a multi-factor model to assess the predicted insurance premium pricing situation in Indonesia. In the design of this model, we incorporate three factors to evaluate insurance prices (substituting Property Prices for Indonesia as the dependent variable, take Index \(2010=100\)), namely WDRI again, GDP, and population.
First, we create the Weather Disaster Risk Index (WDRI) to quantify the factors related to Climate Risk Disaster. Indonesia daily climate data from 2010 to 2022 were gathered to calculate it, focusing on key factors including the average humidity (\(RH_{avg}\), in %), rainfall (\(RR\), in mm), average temperature (\(T_{avg}\), in degrees of Celsius), average wind speed (\(ff_{avg}\)) and duration of sunshine (\(ss\), in hour). Standardization was applied during data processing.
Firstly, \(RR\) (rainfall data) is directly related to floods according to common sense. Secondly, we investigated the relationship between Temperature and Rainfall, finding that rainfall peaked near 26 degrees Celsius, so we took \(|T_{avg}-26|\) as a related influencing factor (see Figure 9). According to online materials6, there is a positive correlation between cloud cover and floods. Assuming the appearance of clouds is negatively correlated with sunlight, we built -\(ss\) as a positively correlated factor. The desired model construction is as follows:
\[WDRI = c(\alpha |T_{avg}-26| + \beta (-ss) + \gamma RH_{avg} + \sigma ff_{avg})RR.\]
Where \(c\) is the scaling factor, \(RR\) is considered as a key factor indicating the amount of rainfall, and \(|T_{avg}-26|\) is applied with reference to the statistical information shown in Figure 9 that rainfall has a peak distribution around \(26 ^\text{o}\)C. \(\alpha , \beta , \gamma ,\sigma\) are coefficients to be determined by Entropy Weight Method. The coefficients obtained are:
\[\alpha = 0.303696, \beta=0.239401 , \gamma=0.186802 ,\sigma=0.270101.\]
Given the climate data of each area in Indonesia, we can calculate the WDRI index for various regions here. At the same time, by collecting data on the local population (pop) and GDP to represent the Style Risk Factor, and assuming the use of property price as the insurance cost indicator, we can use a multiple linear regression model to estimate and predict insurance costs.
Now try to identify the effectiveness of the factors by conducting a correlation analysis among the existing factor sequences (see Figure 10).
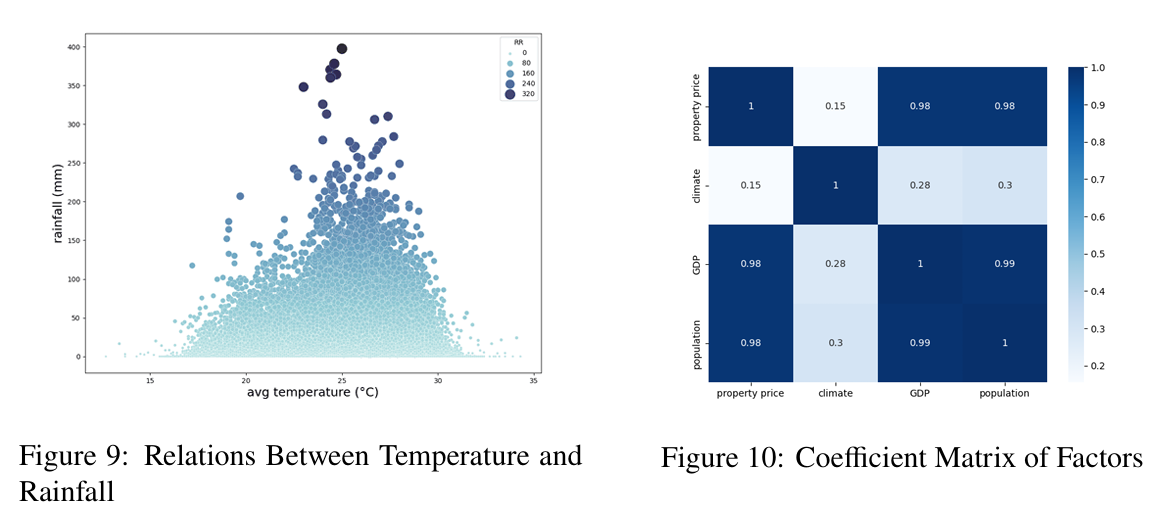
We observe a relatively low correlation between the climate factor and the dependent variable, suggesting that it may be considered for exclusion in the regression analysis. The GDP and population factors exhibit a high correlation, indicating a potential issue of multicollinearity. In our empirical testing, we will monitor the Variance Inflation Factor (VIF) values to address this concern. Regarding the heteroscedasticity of the model, we will not consider it in the prediction problem at the moment.
When attempting to model predictions simultaneously with all three factors, we find that the risk exposure on the dependent variable concerning the GDP factor is not significant. Additionally, the GDP factor contributes significantly to the VIF. Therefore, we initially exclude the GDP factor. Subsequently, we conduct a regression using the climate and population factors, resulting in the following model:
\[\text{insurance price} = -78.36633 WDRI +6.69 \times 10^{-6} population - 1026.793+ \varepsilon.\]
The average \(VIF = 1.10\) and \(R^2 = 0.9831\), indicates a good fit of the model without severe multicollinearity.
Then we utilize the prophet model to forecast future values for population and property prices. Comparing these forecasts with the predicted prices calculated using the insurance model, we obtain the bias as presented in the following table:
| Year | Property price | WDRI | Population | Predicted Price | Bias |
|---|---|---|---|---|---|
| \(2023\) | \(653.8139981\) | $ 2.37908 $ | \(275225919\) | \(628.0286297\) | \(3.94\%\) |
| \(2024\) | $665.8297629 $ | \(2.47889\) | $274957915 $ | \(618.4139396\) | \(7.12\%\) |
| \(2025\) | $675.4485198 $ | \(2.57856\) | \(274697125\) | $ 608.8584824 $ | \(9.86\%\) |
Therefore we have at least \(90\%\) confident that the model is accurate and reasonable.
Statistical data indicates that the per capita GDP of Indonesia in 2022 was \(\$4,788\), and a reasonable estimate for future per capita GDP is around \(\$5,000\). In a given risk scenario, if the predicted premium (represented as the predicted price) exceeds \(5\%\) of the average personal income, it is recommended that the insurance company refrains from underwriting in that region.
Using \(5\%\) as the maximum predicted premium value, the regression model calculates that the climate risk index should be less than or equal to \(0.82\). This data suggests that if the calculated climate risk index for a province in Indonesia exceeds \(0.82\), it is advisable for the insurance company to abstain from underwriting in that region.
In cases where the predicted premium price is greater than \(1\%\) but less than \(5\%\) of the average annual income, the corresponding risk index range should be between \(0.48\) and \(0.82\). It is recommended that the insurance company selectively lowers the loss ratio, keeping it below \(100 \%\) (profitable), for example, setting it at \(60\%\). Under this standard, the insurance company can introduce an insurance product: charging \(\$38\) per square meter of property at one time and paying a premium of \(\$150\) during a five-year insurance period.
In situations where the predicted premium price is less than \(1\%\) of the average annual income, the corresponding risk index range is less than \(0.48\), indicating a lower probability of rainstorm disasters. In such cases, it is suggested that the insurance company slightly increases the loss ratio to enhance its commercial competitiveness in the regional insurance industry, for instance, setting the loss ratio at \(70\%\). Under this standard, the insurance company can introduce an insurance product: charging \(\$12\) per square meter of property at one time and paying a premium of \(\$50\) during a five-year insurance period.
Crucially, a low loss ratio is not always favorable, as it may indicate the company is overly conservative in risk assessment, leading to excessively high premium pricing and potential loss of competitiveness. Also, the establishment of the loss ratio also reflects, to some extent, the social responsibility of insurance companies. In areas like Indonesia where residents' annual income is relatively low with respective to the world average, we recommend insurance companies adopt a higher loss ratio insurance policy to help reduce Insurance Protection Gap for vulnerable people in disasters. This policy not only yields the effect of profits but also helps to establish the responsible social image of the insurance company, contributing to the sustainable development of the enterprise.
Applications to Building Sites Choices
We aim to establish a multifactorial indicator called the Location Viability Index (LVI) to assess whether an area is suitable for developing real estate projects and for living. The three main influencing factors are as follows:
Weather Disaster Risk Index (WDRI) evaluated in the insurance model, which quantifies the disaster risk for each location;
Recommended insurance premium plan for insurance companies according to the insurance model (IPP: No insurance / High Premium / Low Premium);
Projected costs of repairs/rebuilds under potential climate event scenarios (RC).
Recent studies show that the life satisfaction of local residents is mainly related to community density, population size, economic development level, age distribution of residents, and per capita income7. These factors can be approximated as measures of the local viability index (LVI) and used as such after standardization8. This is consistent with common sense, as there is a very high correlation between residents' satisfaction and the livability of an area. Therefore, a linear regression model for LVI can be established based on the above three influencing factors:
\[LVI = b_0 + b_1 WDRI + b_2 IPP + b_3 RC + \varepsilon\]
Where IPP is an integer variable as being \(0\) for no insurance case, \(1\) for high insurance and \(2\) for low insurance according to the insurance model. \(b_0, b_1 ,b_2, b_3\) are coefficients to be estimated according to the dataset.
After obtaining a Location Viability Index that can fit the actual situation well, it can be used to estimate the livability of various areas, and they can be divided into livable and non-livable areas under meteorological disasters according to proportion.
Livable areas need to be prioritized and appropriately developed to accommodate future population growth, with specific measures including:
Construct higher-density residential communities with supporting facilities;
Negotiate with insurance companies and communities to reach cooperation agreements to reduce the residential insurance costs in the area, thereby lowering the living cost and attracting residents.
In the ongoing urban development, the area will be transformed into a vibrant community, where abundant facilities can meet the resources needed for population growth.
For regions that are not suitable enough for living, large-scale vacant land can be developed for tourism and open during disaster-free seasons. Local managers should ensure daily warning and management work, driving the economic development of the local area, and compensating for possible losses caused by weather disasters.
The standards should be re-evaluated every 3-5 years as new risk assessments and climate impact projections are available. This allows development guidelines to adapt.
Landmark Preservation Model
Value of Landmark
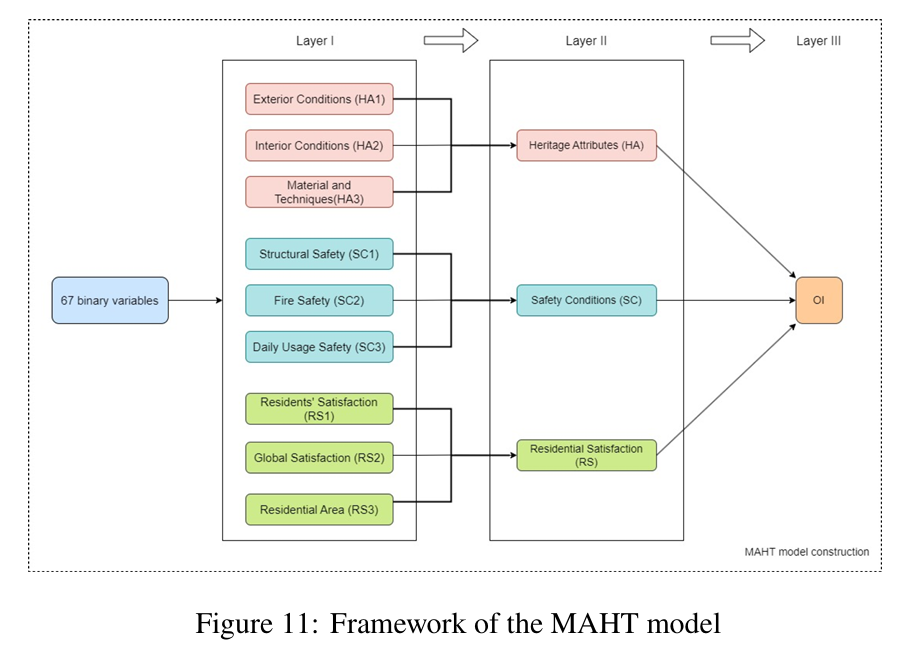
We construct a metric to quantify the value of each landmark first. According to existing study 9, this mainly includes two aspects, heritage attributes and residential satisfaction (for the corresponding MAHT model, see Figure 11). Also, these two indicators are complementary as the Pincipal Component Analysis result shows that these two together can explain \(74.64 \%\) of variance according to the study 10.
On the other hand, this approach is reasonable for our research. Firstly, we discuss landmark historical buildings, which often have important historical and cultural significance. For example, they may have an exquisite structure or a long history. In addition, they carry the memories of residents and have strong emotional values of residents. People are proud to have such a landmark building in their place of residence and love it wholeheartedly. This is also the important value and significance of protecting such community historical landmark buildings.
Therefore, we need to consider this issue from these two aspects: heritage attributes and residential satisfaction. To facilitate the subsequent calculations, we introduce the following symbols to represent the main indicators:
\[(LV, PC2, PC3, HA1, HA2, HA3, HA, RS1, RS2, RS3, RS)\]
Where \(LV\) represents the value of the landmark, and \(PC2, PC3\) represent the 2nd and 3rd principal components. \(HA, HA1,HA2,HA3\) are heritage attribute with its sub-level variables, and \(RS, RS1,RS2,RS3\) are residential satisfaction with its sub-level variables. We approximately describe the result of \(PC2, PC3\) as linear combinations of the main indicators in terms according to the results in the study 11:
\[\begin{gathered} PC2 = 0.89 HA1 +0.939 HA2 + 0.887 HA3 + 0.971 HA \\ PC3 = 0.471 RS1 + 0.604 RS2 + 0.67 RS3 + 0.806 RS \end{gathered}\]
The existing results 12 show that principal component 2 and principal component 3 can represent the two parts of heritage attributes and residential satisfaction indicators, respectively. Therefore, we can set the value of landmark architecture as the sum of the two principal components, which can explain \(37.45\%\) of the variance and has a strong explanatory power. Thus the value of the landmark can be set as the sum of both principle components: \[LV = PC2 +PC3\] Note that according to existing research results 13, the calculation of various indicators for \(HA\) and \(RS\) involves a weighted summation of 31 sub-indicators, which is relatively complex and lengthy. The specific calculation method can be found in Appendix 1, which is not provided in detail here.
Risks of Landmark
The risks that landmark buildings may face need to be considered in two parts. Firstly, there are inherent risks associated with the building itself, such as erosion of building materials or existing structural damage, which can lead to damage to the landmark under extreme weather conditions.
In addition, the external risks of meteorological disasters that the building's location may face should also be taken into account. This is because the landmark buildings considered are located in regions where insurance companies perceive a higher risk of meteorological disasters, thus requiring the inclusion of meteorological disaster risks in the assessment. For the sake of consistency and generality, the Weather Disaster Risk Index established earlier can be directly used as an evaluation indicator.
For the inherent risks of landmark buildings, existing research 14 indicates that the MAHT model can still be used, and the first principal component PC1 from the model can be used as a risk indicator. Therefore, we need to consider this issue from these two aspects: heritage attributes and residential satisfaction. To facilitate the subsequent calculations, we introduce the following symbols to represent the main indicators:
\[(LIR, PC1, SC1, SC2, SC3, SC, OI)\]
Where \(LIR\) represents the inherent risk of the landmark, and \(PC1\) represents the first principal component. \(SC, SC1, SC2, SC3\) are safety conditions with sub-level variables. Moreover, \(OI\) is the third layer variable of the MAHT model. We approximately describe the result of \(PC1\) as linear combinations of the main indicators in terms according to the results in the study 15:
\[PC1 = 0.749 SC1 + 0.729 SC2 + 0.76 SC3 + 0.874 SC + 0.908 OI\]
The existing results 16 show that principal component 1 can represent the safety condition of the landmark. Therefore, we can set the inherent risk of the landmark as the first principal component, which can explain \(37.19\%\) of the variance and has the strongest explanatory power.
Landmark Weather Disaster Vulnerability Index
Note that regarding the indicators related to landmark risk and landmark value mentioned earlier, \(PC1\), \(PC2\), and \(PC3\) come from the same evaluation system and therefore need to be standardized collectively before calculations, where the maximum value normalization method is adopted. The standardized results are respectively denoted as \(PC1^{'}\), \(PC2^{'}\), and \(PC3^{'}\). The calculation method is as follows:
\[\begin{gathered} PC1^{'} = \frac{PC1}{\max \{ PC1, PC2, PC3\}} \\ PC2^{'} = \frac{PC2}{\max \{ PC1, PC2, PC3\}} \\ PC3^{'} = \frac{PC3}{\max \{ PC1, PC2, PC3\}}. \end{gathered}\]
Moreover, the Weather Disaster Risk Index (WDRI) is already standardized data and can be calculated directly. Therefore, the final calculation formula for the Landmark Weather Disaster Vulnerability Index (LWDVI) is:
\[LWDVI = (PC2^{'} +PC3^{'})\times (WDRI +PC1^{'}).\]
Similarly, the standardized result of value of landmark (\(LV\)) can be interpreted as:
\[LV^{\prime} = PC2^{'} +PC3^{'}.\]
Construction of Landmark Preservation Model
Existing research 17 shows that after obtaining the above indicators, decisions can be made based on the satisficing model, making the decision results closest to reality and easiest for policy implementation. The following decision flowchart (see Figure 12) can well reflect our recommended decision-making approach.
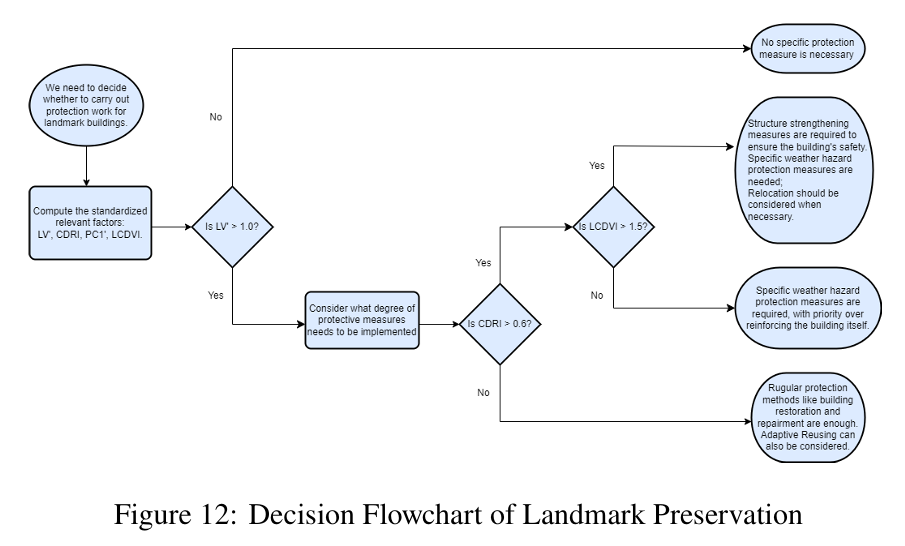
This decision flowchart provides various protection schemes for landmarks with different values and varying internal and external risk levels. The decision-maker also needs to consider factors such as budget and available funds and use the landmark preservation model to determine the appropriate protection measures for the landmark.
Application to Vizcaya Museum and Gardens
Background
The Vizcaya Museum and Gardens, a historic landmark in Miami, Florida, faces significant threats from hurricanes and other natural disasters. The estate has faced numerous hurricanes over the years, including Hurricane Irma in 2017. While the property experienced huge damage, the potential impact of future storms remains a significant concern.
To make matters worse, with a calculated WDRI of \(0.825\) for Miami and the baseline WDRI as \(0.74\), it is advised that the insurance company does not underwrite in the Miami region. Therefore, we need to use the obtained Landmark Preservation Model to consider the most suitable preservation plan for this historic landmark building.
Conclusions Obtained by the Landmark Preservation Model
By inputting the collected data into the MAHT model and the landmark preservation model, the corresponding indicators are obtained as shown in the following table.
| Indicator | Value | Indicator | Value | Indicator | Value |
|---|---|---|---|---|---|
| \(HA1\) | \(0.961538\) | $OI $ | \(0.657534\) | \(PC1^{\prime}\) | $0.53873 $ |
| $HA2 $ | \(0.789474\) | \(PC1\) | \(1.575885\) | \(PC2^{\prime}\) | $ 1 $ |
| \(HA3\) | \(0.611111\) | $ PC2$ | $ 2.925188$ | $PC3^{} $ | \(0.872081\) |
| \(HA\) | \(0.809524\) | $PC3 $ | $2.551 $ | $ WDRI $ | \(0.825347\) |
| \(SC1\) | \(0.347826\) | $LV^{} $ | $1.872081 $ | ||
| \(SC2\) | \(0\) | \(LWDVI\) | \(2.553661\) | ||
| $SC3 $ | $0.5 $ | ||||
| $SC $ | $ 0.387097 $ | ||||
| $RS1 $ | \(1\) | ||||
| \(RS2\) | $ 1 $ | ||||
| \(RS3\) | $ 1 $ | ||||
| \(RS\) | \(1\) |
Based on the obtained results and the decision flowchart, the suitable preservation plan for Vizcaya Museum and Gardens includes the following:
Structural strengthening measures are necessary to ensure the safety of the building. For instance, steel beams or reinforced concrete can be added to the building to reinforce its structural integrity.
Specific weather hazard protection measures are required; for instance, hurricane-resistant windows and doors can be installed to protect the building from harsh weather conditions.
Relocation should be considered when necessary; for example, if the building is located in a high-risk area for natural disasters, it may be safer to relocate it to a less risky location.
However, according to NOAA's intermediate-high sea-level-rise predictions for the years 2060 and 210018, the gardens will sink in 40 years. To make matters worse, typical engineered adaptive measures, such as levees, flood walls, and many flood-proofing techniques are not suitable for Vizcaya. There are no current municipal plans for hard infrastructure improvements to help protect Vizcaya Museum and Gardens from future storms or rising seas.19
Meanwhile, the insurance model for the Miami-Dade County area shows that Vizcaya Museum and Gardens is located in a high-risk area where insurance cannot be obtained. In such unfavorable conditions, the best solution to protect this landmark is to relocate it to a safer location. The one-page community letter is attached to the page before the Appendices.
Sensitivity Analysis
Sensitivity Analysis for Insurance Model
To execute a sensitivity investigation of the flood disaster severity evaluation model, we held the other indices at their current values and progressively enhanced the principle components, subsequently calculating the alterations in the Weather Disaster Risk Index (WDRI) consequential from this adjustment. The resulting data is illustrated in Figure 13.
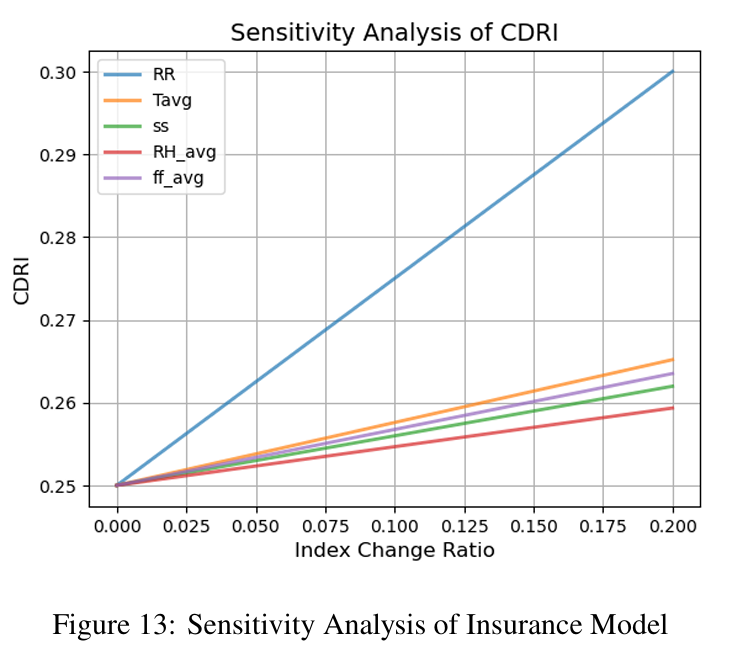
The findings demonstrate that the WDRI is most notably affected when 'Rainfall' (RR) increases, denoting it has the most significant impact. Conversely,less extreme impact of other variables suggest that these elements, though important, have a comparatively smaller effect. From these results, it's evident that flood disaster severity is most sensitive to rainfall levels. This is consistent with the concrete scenario, as rainfall is undeniably a central factor in determining the intensity and likelihood of floods. Consequently, in devising disaster mitigation strategies, the focus should primarily be on developing flood control measures that can effectively deal with high rainfall levels.
Lastly, our findings also suggest that the model is robust and can reliably anticipate disaster severity, even in the face of minor data errors. This feature enhances the model's practical applicability and value in real-world disaster planning and management.
Sensitivity Analysis for Landmark Preservation Model
To conduct a sensitivity analysis of the landmark preservation model, we fixed the other indicators at their current values and incrementally increased the principle components and then calculated the change in the Landmark Weather Disaster Vulnerability Index (LWDVI) resulting from this adjustment. The results are shown below in Figure 14.
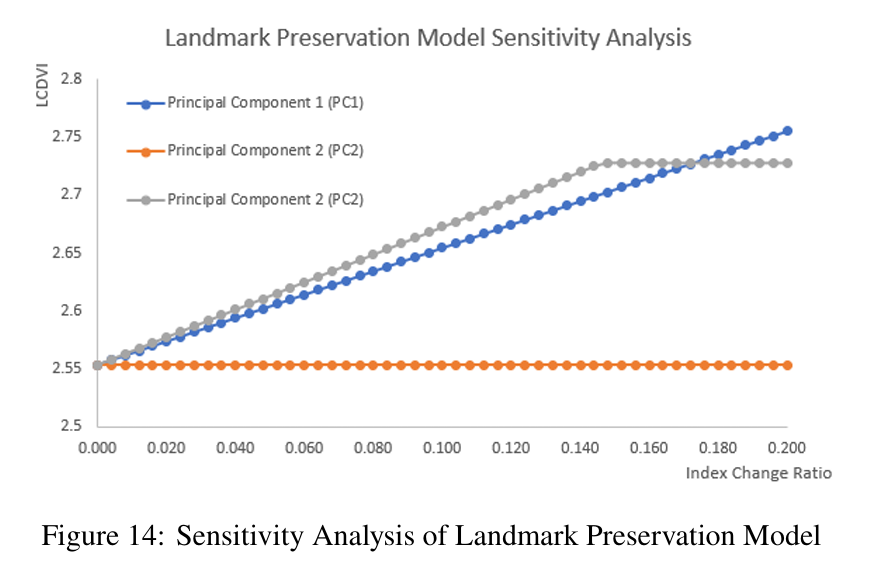
The results indicate that the Landmark Weather Disaster Vulnerability Index (LWDVI) is most significantly affected when the relevant indicators change by the same proportion and the 3rd principal component (PC3) increases when the index change ratio is less than 0.174. On the other hand, the LWDVI is most significantly influenced by the change in the 1st principal component (PC1) when the index change ratio is greater than 0.174. This suggests that the LWDVI is most sensitive to the inherent risk of the landmark building itself because both components are related with the strength of the landmark. Therefore, under the condition of limited funding and manpower, repairing and protecting the landmark itself should be given the highest priority.
The result also shows the model is robust even if there're some errors in data.
Model Evaluation and Further Discussion
Strengths
Close to reality: Our research is based on a large amount of real statistical data. For example, we obtained historical hurricane data through the National Oceanic and Atmospheric Administration (NOAA) and local property data through the University of Florida's research institute.
The work references a large number of classic methods, as well as innovative methods that have been verified in specific research fields. For example, the MAHT model 20 referenced in Task 4 was developed by experienced experts and has been convincingly validated. Therefore, our model is supported by sufficient data and reasonable methodologies and can be considered a reasonable simulation of the real world.
Reasonableness: The Insurance Model can predict the future trends of weather disasters based on historical data, providing reasonable insurance advice and arrangements. The resulting real estate location choices are reasonable and align well with our expectations and actual circumstances. The Landmark Preservation Model accurately captures the value and risks faced by historical buildings, guiding decision-makers to make reasonable judgments. The simulation results are all intuitive and consistent with reality, so the model is reasonable.
Humanistic Care & Social Responsibility: When setting insurance prices, the Insurance Model takes into account the difficulties of local communities in the event of a disaster by achieving a minimum Insurance Protection Gap, which reflects the sense of social responsibility and care for people. The Landmark Preservation Model, when assessing historic buildings, considers the satisfaction of residents. It quantifies this as part of the model and makes it work, doing its best to protect people's precious memories. Therefore the model also takes into account humanistic care and social responsibility.
Objective: The entropy weighting method is used to determine the weights of indicators, avoiding the influence of personal subjective factors.
Robustness: The sensitivity analysis shows that our model can still output good results when faced with biased data. It has a strong resistance to data errors and demonstrates a certain robustness and stability.
Weaknesses
The Landmark Preservation Model does not have a comprehensive consideration of economic effects, so it still has limitations in practical application.
There is potential for enhancement in our selection of indicators, and certain indicators could be represented with more suitable and sufficient data.
Conclusion
We propose a multi-factor model of insurance which takes into account three main aspects: weather disaster risks, section risk factors and style risk factors. This model has been used to solve problems from twodifferent continents, demonstrating its powerful generality and adaptability. It is also used to assist insurance companies in formulating insurance strategies and helping real estate companies adapt to future changes. It has strong versatility and can help people in various industries.
We have also developed a Landmark Preservation Model based on the latest research results called MAHT. It considers four influencing factors: extreme weather risk exposure to the landmark, its vulnerability, people's satisfaction with it, and its historical and cultural significance. By categorizing these factors, we obtained numerical values to assess the necessity of protecting the landmark and created a decision flowchart to assist decision-makers in formulating different protection measures based on the circumstances. This model was used to analyze the preservation measures for the Vizcaya Museum and Gardens and, based on the results, a community letter was written to local residents. It can make significant contributions in the aspect of community heritage preservation.
Community Letter
February 4th, 2024
Dear residents of Miami-Dade County,
We hope this letter finds you well and thriving in our vibrant community. Today, We write to you with a matter of great importance concerning one of our most cherished local landmarks, the Vizcaya Museum and Gardens.
As many of you are aware, the Vizcaya Museum and Gardens suffered substantial damage during Hurricane Irma in 2017. The increasing threat of rising sea levels and frequent hurricanes, coupled with unsuitable repairment conditions, have put this iconic landmark at significant risk. After thorough consideration with calculations through our Landmark Preservation Model, the recommendation has been made for the relocation to ensure its preservation for future generations.
The cost of relocating such a significant site is substantial, and preliminary calculations suggest that the entire project is about 80 million dollars, considering the difficulties in relocating and preserving. The financial burden will be borne by government. Donations are welcome during the whole process, and every donation, no matter the size, will play a crucial role in safeguarding a piece of our shared heritage.
The relocation and preservation project will be managed by professional companies, ensuring that every aspect of Vizcaya is handled with the utmost care and expertise. The project is planned to unfold in five phases over the next five years, outlined as follows:
Phase 1: Planning and Fund Collecting - A detailed planning will be finalized and the initial funding will be secured. (6 months)
Phase 2: Preparing - New foundations will be prepared well. At the same time, stabilization works to ensure minimal damage will be done to the building. (18 months)
Phase 3: Initial Relocation Phase - Beginning the physical relocation of smaller structures and artifacts, including small collectibles, sculptures, plants, and so on. (12 months)
Phase 4: Main Relocation Phase - Relocating the Main House and larger structures, alongside significant restoration works. (12 months)
Phase 5: Finalization and Restoration - Completing the relocation, with a focus on restoration, landscaping, and public reopening. (12 months)
We extend our deepest gratitude for your love for Vizcaya and invite you to be a part of this monumental effort to preserve our history and culture. It is this collective passion that has kept Vizcaya's spirit alive through challenging times, and it is this same passion that we call upon now to ensure its future. It takes a village, but it's worth it.
Thank you for your attention and support.
Sincerely,
COMAP's Insurance of Catastrophes Modelers (ICM)
Appendices
Calculation Details of the MAHT Model
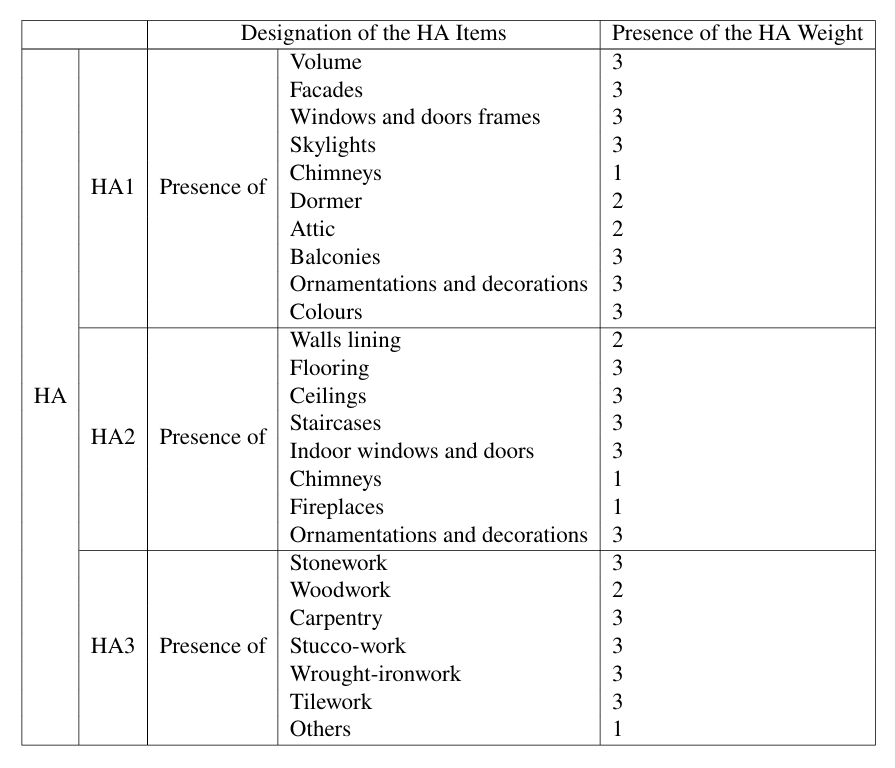
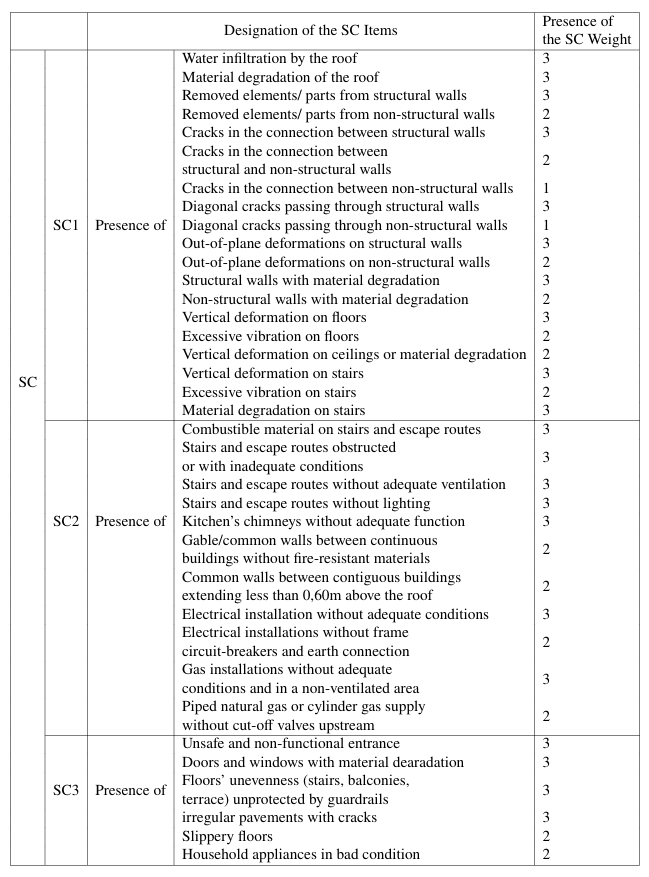
According to the existing study 21, we can obtain the design thinking and calculation methods behind the MAHT model. For the sake of simplicity, this part has been used multiple times in the main text's Landmark Preservation Model, but it has not given specific calculations for HA, SC, and RS, as well as the relevant evaluation criteria. Therefore, it is supplemented in the appendix for future reference.
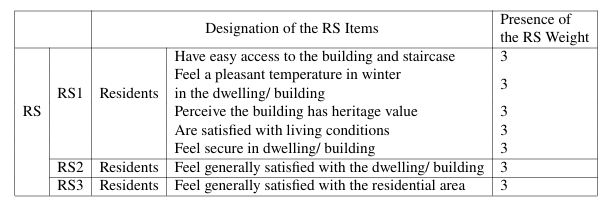
The MAHT's first dimension considers the Heritage Attributes (HA) of the urban landmark, which identifies the physical features and constructive characteristics of urban fabrics. Its second dimension evaluates Safety Conditions (SC), which identifies the presence of damage, malfunction, and fire dysfunctional conditions. Also, its third dimension considers Residential Satisfaction (RS),which is assessed through face-to-face interviews.
The detailed sub-indicators with weights designed by experienced specialists are listed below.
References
C. Ornelas, F. Sousa, J. M. Guedes, and I. Breda-Vázquez, “Monitoring and assessment heritage tool: Quantify and classify urban heritage buildings,” Cities, vol. 137, p. 104 274, 2023, issn: 0264-2751.↩︎
L. Liu, Y. Wang, and H. Wang, “The performance of three exponential decay models in estimating tropical cyclone intensity change after landfall over china,” Frontiers in Earth Science, vol. 9, 2021, issn: 2296-6463. doi: 10 . 3389 / feart . 2021 . 792005.↩︎
S. P. Cottrell, J. J. Vaske, and J. M. Roemer, “Resident satisfaction with sustainable tourism: The case of frankenwald nature park, germany,” Tourism Management Perspectives, vol. 8, pp. 42–48, 2013, issn: 2211-9736.↩︎
K. Irandoost, A. A. Isaloo, and B. Shahmoradi, “Viability index in urban environments (case study: The central part of holy city of qom),” Journal of Urban Economics and Management, vol. 4, no. 13, pp. 101–118, 2016.↩︎
L. Liu, Y. Wang, and H. Wang, “The performance of three exponential decay models in estimating tropical cyclone intensity change after landfall over china,” Frontiers in Earth Science, vol. 9, 2021, issn: 2296-6463. doi: 10 . 3389 / feart . 2021 . 792005.↩︎
Protecting the world from flood risk: Why we invested in cloud to street, https://www.preventionweb.net/news/protecting-world-flood-risk-why-we-invested-cloud-street, Accessed: 2024-02-05.↩︎
S. P. Cottrell, J. J. Vaske, and J. M. Roemer, “Resident satisfaction with sustainable tourism: The case of frankenwald nature park, germany,” Tourism Management Perspectives, vol. 8, pp. 42–48, 2013, issn: 2211-9736.↩︎
K. Irandoost, A. A. Isaloo, and B. Shahmoradi, “Viability index in urban environments (case study: The central part of holy city of qom),” Journal of Urban Economics and Management, vol. 4, no. 13, pp. 101–118, 2016.↩︎
C. Ornelas, F. Sousa, J. M. Guedes, and I. Breda-Vázquez, “Monitoring and assessment heritage tool: Quantify and classify urban heritage buildings,” Cities, vol. 137, p. 104 274, 2023, issn: 0264-2751.↩︎
C. Ornelas, F. Sousa, J. M. Guedes, and I. Breda-Vázquez, “Monitoring and assessment heritage tool: Quantify and classify urban heritage buildings,” Cities, vol. 137, p. 104 274, 2023, issn: 0264-2751.↩︎
C. Ornelas, F. Sousa, J. M. Guedes, and I. Breda-Vázquez, “Monitoring and assessment heritage tool: Quantify and classify urban heritage buildings,” Cities, vol. 137, p. 104 274, 2023, issn: 0264-2751.↩︎
C. Ornelas, F. Sousa, J. M. Guedes, and I. Breda-Vázquez, “Monitoring and assessment heritage tool: Quantify and classify urban heritage buildings,” Cities, vol. 137, p. 104 274, 2023, issn: 0264-2751.↩︎
C. Ornelas, F. Sousa, J. M. Guedes, and I. Breda-Vázquez, “Monitoring and assessment heritage tool: Quantify and classify urban heritage buildings,” Cities, vol. 137, p. 104 274, 2023, issn: 0264-2751.↩︎
C. Ornelas, F. Sousa, J. M. Guedes, and I. Breda-Vázquez, “Monitoring and assessment heritage tool: Quantify and classify urban heritage buildings,” Cities, vol. 137, p. 104 274, 2023, issn: 0264-2751.↩︎
C. Ornelas, F. Sousa, J. M. Guedes, and I. Breda-Vázquez, “Monitoring and assessment heritage tool: Quantify and classify urban heritage buildings,” Cities, vol. 137, p. 104 274, 2023, issn: 0264-2751.↩︎
C. Ornelas, F. Sousa, J. M. Guedes, and I. Breda-Vázquez, “Monitoring and assessment heritage tool: Quantify and classify urban heritage buildings,” Cities, vol. 137, p. 104 274, 2023, issn: 0264-2751.↩︎
H.-J. Wang and Z.-T. Zeng, “A multi-objective decision-making process for reuse selection of historic buildings,” vol. 37, no. 2, pp. 1241–1249, Mar. 2010, issn: 0957-4174.↩︎
S. F. R. C. C. Compact, “Unified sea level rise projection southeast florida: 2019 update,” vol. 27, 2022.↩︎
L. R. Hall, “Preemptive strategies and collaboration for emergency planning: Lessons learned at vizcaya in miami,” APT Bulletin: The Journal of Preservation Technology, vol. 52, no. 2/3, pp. 15–24, 2021, issn: 08488525. (visited on 02/03/2024).↩︎
C. Ornelas, F. Sousa, J. M. Guedes, and I. Breda-Vázquez, “Monitoring and assessment heritage tool: Quantify and classify urban heritage buildings,” Cities, vol. 137, p. 104 274, 2023, issn: 0264-2751.↩︎
C. Ornelas, F. Sousa, J. M. Guedes, and I. Breda-Vázquez, “Monitoring and assessment heritage tool: Quantify and classify urban heritage buildings,” Cities, vol. 137, p. 104 274, 2023, issn: 0264-2751.↩︎